
How to track Indian Economy? using 16 High Frequency Indicators
- Vinay Nair

- Oct 12, 2019
- 9 min read
Updated: Oct 14, 2019
Just as a doctor checks the vitals of a patient before arriving at a diagnosis, economists analyse the state of an economy by putting it through sixteen High-Frequency Indicators of Economic Activity (IEA), and comparing the statistics accordingly.
One may wonder: how do the economists arrive at these figures in the first place? No matter how laden with jargon these indicators may initially seem, the matter at the heart of it all is actually rather simple, with each indicator measuring a crucial aspect of our economy.
The following are the four main categories that we use to sound out Indian economic health:
Consumer Economy
Industrial Sectors
External Sector
Ease of Living

Consumer Economy Indicators
As most economists would tell you about the latest Indian economic crisis, what we have is essentially a demand side problem, with potential consumers refusing to shell out cash to get their hands on consumer durables.
1. Passenger Vehicle Sales
This particular indicator is meant to find out how many domestically produced cars, mini-vans and light trucks are being sold, as opposed to a similar period in the previous year.
A year-on-year rise or decline helps us understand the general sentiment of consumers as purchase of personal vehicles constitutes a large portion of consumer expenditure in any country.

If we take India, for example, we will see that the passenger vehicle sales have fallen by 25.60% from 2018 figures as of September 2019.
This essentially indicates the persistence of the downturn in consumer sentiment and a general lack of vigour in the demand side of the economy.
Considering that the overall auto industry collectively provides direct employment to roughly 20 million Indians and make up over 45% of the manufacturing GDP
The status of the auto sales definitely speaks to the fortunes of a massive chunk of the Indian populace.
2. Sales of Two Wheelers
Similar to the indicator assessing passenger vehicle sales, the sales of two wheelers also provides a reading into consumer sentiments in the country. Since they are cheaper and more accessible for large swathes of the population, they are generally expected to enjoy high sales at a time of economic buoyancy.
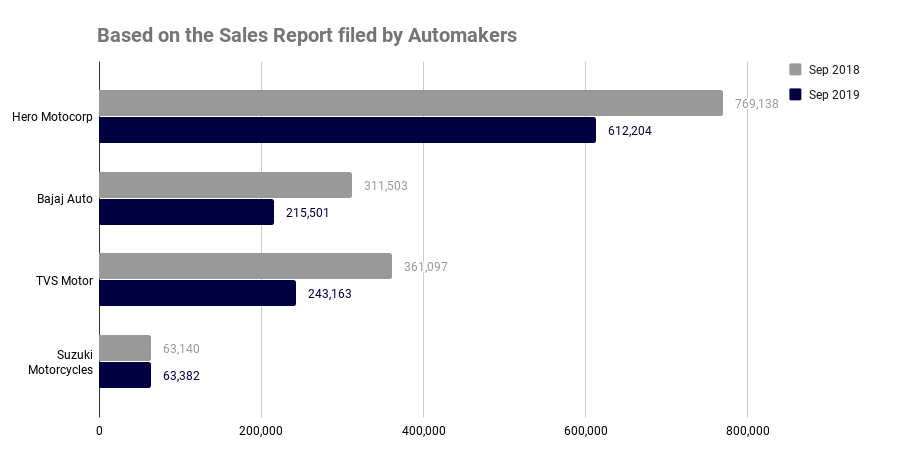
For India, unfortunately, even this indicator does not look too good of late, with sales having fallen by 11.70% over the last year.
3. Tractor Sales
This indicator measures tractor sales in a given period, and while it is quite similar to the one above, it is primarily used to assess a different sector of our economy. Since the use of tractors is inextricably linked to the agricultural sector, it helps us understand how farmers have been faring of late. High tractor sales during a given period signals agricultural prosperity and tells us that the farmers of our country are doing well enough to invest in tractors. A large sales volume also speaks to the farmers' willingness to expand production, indicating a healthy development of the agricultural sector.
Moreover, the tractor sales tend to depend on the vagaries of monsoon, with the figures skyrocketing when the monsoon rainfall is abundant and evenly spread out. Therefore, high sales figures in this space testifies to an abundant monsoon and agricultural success. Overall, it is a fairly reliable indicator to assess both consumption patterns as well agricultural production, both of which are crucial elements in a burgeoning economy.

India, with its tractor sales having fallen by 13.60% this June over last year, seems to be doing quite poorly in this regard as well.
4. Domestic Air Passengers
This indicator provides an insight into the high value air travel market, by studying the number of people choosing to fly within the country. This explains people's general spending patterns and also helps us predict the near future of the airline industry. Passenger loading and seat occupancy across airline providers are evaluated to arrive at a final figure for this indicator.
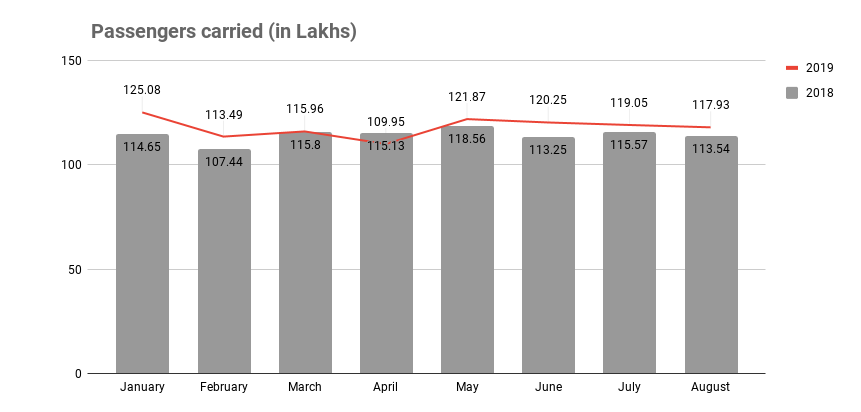
India itself has been experiencing a downturn in this respect too, with the number of domestic air passengers sliding down by 2.80% as of June 2019.
With these four indicators helping us read into the health of the consumer economy, we need to now look at the indicators that shed light on some of the other facets.
Industrial Sector Indicators
The importance of the industrial sector is unquestionably paramount in laying the foundations of a strong economy. It provides jobs, supplies inputs to other sectors and powers the country's trade balance in relations with other countries. To assess it, we study the extent of credit flow and prospects alongside the likes of core growth rate, which give us an idea of the industrial health of our country.
It is a widely accepted fact that a country's economy is largely hinged upon a robust industrial sector, and to evaluate that effectively, following are the Indicators we make use of:
5. PMI Manufacturing
In this indicator, PMI stands for "Purchasing Managers' Index", and gives us a reading into the trends of the manufacturing sector, which is a major part of our economic make up.
The preparation of this index is based on a survey of senior executives and top managers within the manufacturing and supply chain sectors, who give their views on prevailing market conditions, and their projections for the near future. Working as a diffusion index, it allows us to figure out whether market conditions are expanding or contracting. Usually, having a figure below 50 means that it is contracting, and vice versa.

However, it is also quite worrying if the figure is only slightly above 50 (which happens to be the case with India in September 2019) as that means the market conditions are not expanding fast enough to warrant a celebration.
6. Core Growth
This index studies the growth or decline in the core industries that make up the backbone of an economy.
India has about 8 (electricity , steel, refinery products, crude oil, coal, cement, natural gas and fertilizers) of them, contributing a total of 40.27% in the total weight of items in the Index of Industrial Production.
A sizeable expansion in the output of these eight industries is usually a cause for rejoicing while a decline triggers concerns.

While India has experienced only a 0.20% de-growth as of June 2019 in this regard, a lack of expansion is also reason enough to worry.
7. Bank's Non Food Credit
This indicator is meant to see how much credit is flowing to the various sectors of the economy not related to the production and procurement of food grains.
It is measured by studying the outstanding amount of loans provided to businesses by banks, to assess whether the credit flow is adequate enough to leave the economy flushed with adequate liquidity.
With India's credit been drying up of late, non-food credit growth in the fortnight ending 27 September slowed to as low as 8.7% year-on-year to ₹97.11 trillion
8. Rail Freight Traffic
This indicator is used to measure how much cargo is being moved around the country via railroads, and is considered to be a major indicator of a nation's economic health.
If the amount of commodities being transported by railways in bulk is high, it effectively means that more products are moving from place to place to be bought and sold, and that essentially means that the economy is doing well.
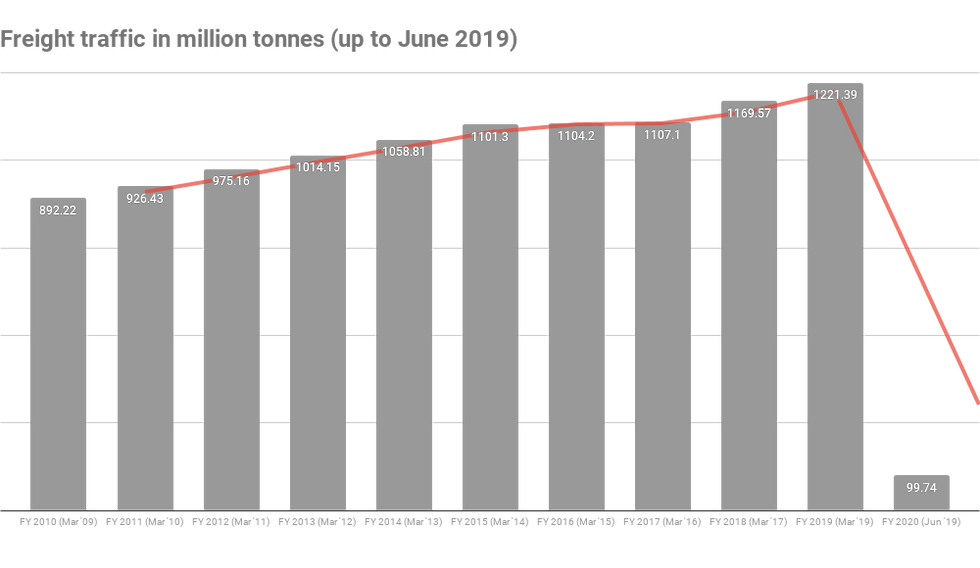
The Indian economy, which is experiencing a 2% fall in its rail freight traffic as of June 2019, is clearly not doing well enough.
Having taken stock of all the elements that help us evaluate the state of our industries, it is time to have a look at those that make up the prospects for our external sector.
External Sector Indicators
When it comes to sounding out the state of an economy, its external sector is as relevant as internal considerations.
The external sector of an economy primarily deals with its interactions with economies of other countries, taking stock of imports and exports in the goods market, and capital outflows in the financial market. This essentially helps us determine how an economy is faring in relation to peer economies.
9. Import Cover
This indicator measures how many months of imports can be accounted for by the amount of foreign exchange reserves being held by the central bank of the country.
Usually, an economy is considered to be fairly healthy, if the central reserves are enough to cover around 8-10 months of imports.

As of June 2019, India's import cover is 10.40, which indicates a rather stable external sector.
10. Rupee (National Currency) Versus Dollar
Comparisons of a country's national currency with the dollar are usually quite commonplace and this indicator is basically a statistical representation of the same. If the value of the rupee rises (that is, one can purchase more products/services with a given amount than earlier) in relation to the dollar, it indicates that the economy is healthy. If it seems to be falling on a month-to-month basis (with things becoming more expensive, and one being able to purchase less utility with the same amount), it indicates a downturn in the economy.

India, in June 2019, recorded a 0.5% rise in its value over the previous month, effectively signalling an improvement.
11. Current Account Balance (as a percentage of GDP)
The current account of a country is arrived at by adding the trade balance with their net income and direct payments. The trade balance is a measure of the balance between exports and imports (with higher exports being preferable for a healthy balance).
This measure usually includes the figures for goods, services, income and current transfers (amounts given out without any hope of receiving returns, like workers' remittances, for example). A surplus in this usually means that the country is not a borrower from the rest of the world, while a deficit indicates otherwise.
However, a small deficit is not necessarily reflective of a failing economy, as that might mean that the government of the country is accruing debts in order to invest further for its long term future.

India, with a 0.60% deficit in the current account balance as of June 2019, seems to be in the safe zone in this regard, as it is significantly higher than the 1% deficit level.
12. Trade Balance (as a balance of Total Trade):
As we have already explained, trade balance refers to the difference between the monetary value of imports and exports made in a given period. That value, as a balance of the total trades made, makes up this indicator. The balance is considered to be poor if it falls below a 5-year average band, and not simply if it is running in the negative.

India, where trade balance fell by as much as 23.40% as of June 2019, is definitely considered to be having a poor trade balance of late.
While these four factors make up our reading of the external sector, four more indicators serve to assess the ease of living, thereby rounding up our list of high frequency macroeconomic indicators.
Ease of Living Indicators
This segment of our indicators deals with how conducive it is for the common people of our country to live and work in the current state of our economy. It measures the relationship consumers share with prices of everyday goods, and how well employment opportunities seem to be panning out for the youth of the nation.
13. Consumer Price Index
In this indicator, we must measure how price level is changing for a weighted average market basket of goods and services. This essentially means that a sample set of goods and services are taken together, and their overall price changes are tracked over time, to yield this value.
A low consumer price index means that inflation is under control, and the economy is doing well.

India, with a fairly low CPI of 3.20% year on year, seems safe in this regard.
14. Core Consumer Price Index
This indicator is similar to the one above, but it leaves out those goods and services that are likely to experience high volatility or rapid price changes. This means that the weighted average market basket for Core CPI would leave out the likes of tobacco, alcohol, certain food products, LPG, kerosene etc.

Having risen by just 4.10% in June 2019 over the previous year, India's core CPI can be said to be quite stable as well.
15. Rural Wages
The growth or decline in the average wages received by rural labourers also serves as an important indicator of our economic health.
Even if it's positive, it does not necessarily indicate that the economy is healthy.
The value must ideally remain above the 5-year average band to considered so, explaining why India's 4.20% growth in rural wages also leaves this indicator in the red as of June 2019.
16. Job Outlook
Like PMI Manufacturing, this indicator also makes use of surveys to arrive at the final value.
The balance between optimistic and pessimistic responses about job outlook in the country helps us figure out what the general sentiment is, with regard to the possibility of gainful employment in the country.
In March 2019, India's job outlook rose by 9.80%, indicating that a higher number of people were confident about India's job prospects.
[Bonus] Consumer Confidence Index
This is another indicator that is used commonly around the globe to assess optimism among consumers, and thereby, their propensity to actually spend their hard-earned money on consumer durables.
Usually evaluated by surveying a carefully collated sample population, this index yields a deeper understanding of how the common men and women of a country feel about the expected trajectory of their financial situation. Depending on the organization carrying out the survey, this indicator often includes sub indices such as economic expectations, jobs, situations surrounding investments and personal finance.
A recent RBI survey reveals that India's consumer confidence has hit a six-year low, while another study conducted by Thomson Reuters and Ipsos tells us that this metric has taken a dip by about 3.1% as of August 2019.
These 16+ indicators together make up our understanding of how well our economy is doing, and whether or not it is on the path to recovery.
As India's former chief economic advisor Arvind Subramaniam wrote in a Harvard working paper,
".....there is a 'high likelihood of there being large over-estimation' in India's new GDP series, which suggests that the official GDP estimates may not be accurate....."
He suggests that India's growth rate will be something between 3.5% to 5.5%, and not the inflated figures the government tends to boast of.
This assertion leads us to appreciate more deeply the value of these 16 indicators, as a cautious study of those can guide us in arriving at the correct figure. There are plenty of sources available to us to take stock of our economic health, and the likes of the Mint Macro Tracker makes that job particularly easier.
The important thing to remember is that all these elements collectively make up our economy and influence our prospects going forward, making them imperative to understanding the state of our economy


Comments